마이크로프로파일러에는 여러 모드가 있으며, 경험의 성능 특성을 다양한 방식으로 시각화하는 데 도움이 됩니다.MicroProfiler를 CtrlAltF6 ( ⌘⌥F6 )로 열고 나서, 모드 메뉴를 사용하여 서로 전환합니다.
프레임 모드
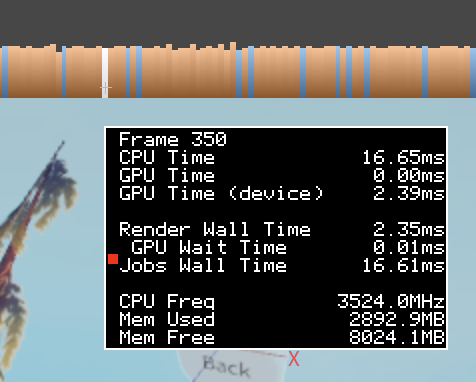
가장 기본적인 모드인 프레임 모드 는 오른쪽(가장 최근)에서 왼쪽으로 흐르는 프레임의 막대형 그래프를 표시합니다.각 바의 높이는 프레임을 완료하는 데 걸린 밀리초 수를 나타냅니다.프레임 위로 마우스를 이동하여 CPU 및 GPU 사용량에 대한 기본 정보를 확인합니다.

주황색 막대는 프레임을 나타내며, 작업 벽 시간 이 렌더링 벽 시간 을 초과하는 경우를 나타냅니다.이 프레임에서 스크립트 실행, 물리 계산 및 애니메이션 재생과 같은 작업을 수행하는 작업자 스레드 중 하나는 메인 렌더링 스레드보다 실행 시간이 더 길었습니다.
경험이 프레임 시간 목표에 도달하지 않고 오렌지색 프레임이 많은 경우, 일반적인 원인은 스크립트, 물리 및 애니메이션입니다.참조 성능 향상.
파란색 막대는 Render Wall Time 이 Jobs Wall Time 을 초과하는 프레임을 나타냅니다.이 프레임에서 주 렌더링 스레드는 작업자 스레드 중 어느 것보다 많은 시간이 걸렸습니다.
경험이 프레임 시간 목표에 도달하지 않고 많은 파란색 프레임을 가지고 있으면 렌더링 병목이 있음을 나타냅니다.일반적인 원인은 과도한 개체 밀도, 개체 이동 및 조명입니다.참조 성능 향상.
빨간색 선은 두 조건이 모두 참인 프레임을 나타냅니다:
- 렌더링 벽 시간 이 작업 벽 시간 을 초과합니다
- GPU 대기 시간 이 2.5밀리초 이상입니다
빨간색 막대는 주황색과 파란색보다 덜 일반적이며 과도한 개체 복잡성, 텍스처 크기 및 시각 효과의 결과일 가능성이 높습니다.최적화는 파란색 막대와 유사합니다.참조 성능 향상.
프레임 끝의 작은 작업은 때로는 프레임 색상보다 프레임 시간에 집중하는 또 다른 이유인 작업 벽 시간과 렌더링 벽 시간을 던질 수 있습니다.좋은 프레임 색상이 없어서 고정할 수 없습니다.경험의 프레임 시간 목표에 도달하는 한, 오렌지, 블루, 레드의 혼합은 문제가 되지 않습니다.프레임 시간 목표에 도달하지 않는 경우 색상은 최적화할 위치를 나타낼 수 있습니다.
프레임 모드에서 중지하는 마이크로프로파일러는 ( ) 세부 모드를 시작하면서 세부 모드를 시작합니다.
세부 모드
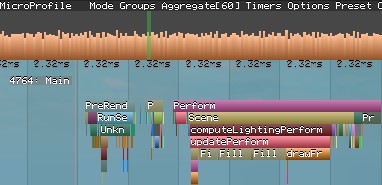
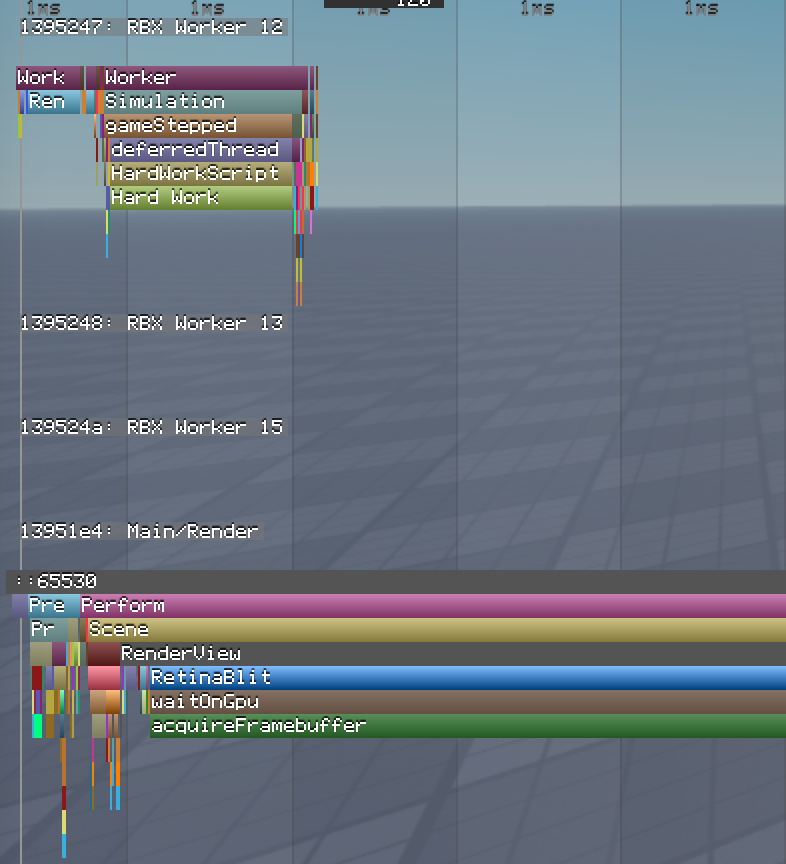
프레임 모드의 가로 막대형 그래프 외에도 상세 모드는 각 태스크에 대한 레이블을 보여 주는 색상 시간표를 추가합니다.
다른 레이블 아래에 나타나는 레이블은 상위 수준 작업의 일부로 수행되는 작업을 나타냅니다.
부모 태스크보다는 일반적으로 성능이 가장 좋지 않은 자식 태스크를 해결하려고 합니다; 부모 태스크는 자식 태스크의 합계보다 짧을 수 없습니다.
스크롤하여 타임라인을 확대하거나 축소합니다.타임라인 상단의 밀리초 레이블과 결합하여 절대적인 의미에서 작업이 얼마나 걸렸는지, 그리고 다른 작업과 비교하여 얼마나 걸렸는지 알 수 있습니다.

막대형 차트의 녹색 오버레이는 현재 타임라인에 표시되는 프레임 수를 나타냅니다(즉, 당신의 확대 레벨).프레임 바를 왼쪽 클릭하여 타임라인에서 해당 위치로 이동합니다.
배율 레벨조정해야 할 수도 있지만, 막대를 가리키면 타임라인의 프레임이 강조 표시됩니다. 연회색 선은 프레임을 구분합니다.

타임라인을 이동하려면 왼쪽 클릭하고 드래그하세요.많은 CPU 코어가 있는 컴퓨터에서는 특정 작업을 수행하는 주 스레드나 작업자 스레드를 찾기 위해 조금 위쪽이나 아래쪽으로 이동해야 할 수 있습니다.

레이블을 마우스 오른쪽 버튼으로 클릭하여 타임라인을 해당 작업의 정확한 기간으로 확대합니다.
레이블을 왼쪽 클릭하여 오른쪽 하단의 선형 그래프에 추가합니다.그래프는 태스크가 각 프레임에서 소요하는 시간을 보여줍니다.이 그래프를 사용하여 게임에서 특정 작업의 성능만 테스트할 수 있습니다.완료되면 그래프를 마우스 오른쪽 버튼으로 클릭하여 숨깁니다.

정보량이 압도적이면 레이블을 호버하여 그룹을 찾습니다.그런 다음 그룹 메뉴를 사용하여 타임라인을 물리학이나 렌더링과 같은 하나 이상의 그룹으로 필터링합니다.

타임러 모드
타이머 모드 는 상세 보기에서 데이터를 시각화하는 대체 방법으로, 처리 시간과 호출 수가 포함된 레이블 목록입니다.일부 열에서 가로 막대형 그래프는 가장 바쁜 작업을 찾는 데 도움이 됩니다.

컨트롤은 자세한 보기와 유사합니다:
- 왼쪽 클릭 및 홀드로 위쪽과 아래쪽으로 이동합니다.
- 레이블을 왼쪽 클릭하여 오른쪽 하단의 선형 그래프에 추가합니다.
- 그룹 메뉴 를 사용하여 목록을 필터링합니다.
- 타이머 메뉴( 타이머 )를 사용하여 열을 사용자 지정합니다.
카운터 모드
카운터 모드는 다양한 태스크에 대한 인스턴스 수와 메모리 사용량(바이트)을 포함한 긴 목록의 범주 및 통계입니다.

- 자세한 보기와 마찬가지로 왼쪽 클릭하고 길게 누르면 위쪽과 아래쪽으로 이동할 수 있습니다.
- 그래프 열에서 그래프 열을 왼쪽 클릭하여 최소값과 최대값을 포함한 작은 사용량 그래프를 추가합니다. 그래프를 다시 왼쪽 클릭하여 확장합니다.
- 그래프를 마우스 오른쪽 단추로 클릭하여 닫습니다.
- 이 뷰를 필터링할 수는 없지만 카테고리(예: memory)를 왼쪽 클릭하여 축소할 수 있습니다.
카운터 모드는 유용할 수 있지만, 개발자 콘솔 은 메모리 문제를 식별하는 데 권장되는 방법입니다.문제가 있는 메모리 할당이 발생할 때를 식별하는 데 웹 UI의 X-레이 뷰도 유용하다고 생각할 수도 있습니다.
숨겨진 모드
숨겨진 모드는 마이크로프로파일러 메뉴를 열어놓지만 막대 그래프를 숨깁니다.시각적 혼란을 줄이고, 프레임 데이터 저장 , 선 그래프를 관찰하면서 일시 중지와 일시 중지를 중지하는 데 유용합니다.