The MicroProfiler is a performance optimization and troubleshooting tool available in Roblox Studio and the Roblox client. It provides detailed timing information for task scheduler tasks called tags.
- For a list of common tasks, refer to the tag reference.
- For a step-by-step example of using the MicroProfiler to identify a performance issue, see the MicroProfiler walkthrough.
MicroProfiler basics
To open the MicroProfiler, press CtrlAltF6 (⌘⌥F6) in Studio or the client. You can also use the settings menu in the client.
When open, a menu bar is visible at the top of the 3D viewport. In the default mode, a moving bar graph shows the time used on each frame of the Task Scheduler.
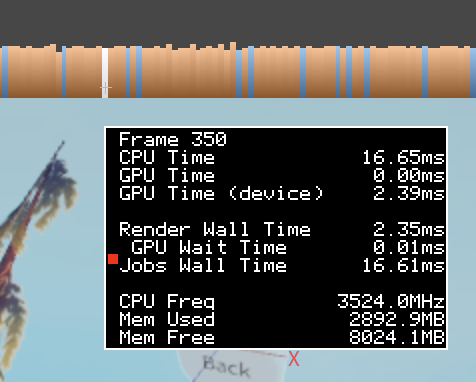
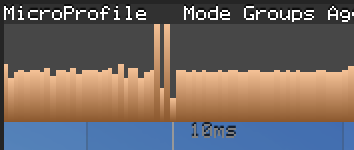
Bars should generally be around the middle of the graph, but you might see sudden spikes (rapid increases in values). Spikes indicate that more time was taken to perform some task, usually because of an increased workload. For instance, creating a lot of moving parts requires more work from the physics simulation, which then needs more time to process motion and part contacts. The following image shows an example of a spike:
To pause the recording of frames, press CtrlP (⌘P) or click Pause in the menu bar. While paused, a timeline appears, and you can navigate through frames by clicking or dragging on the graph.
For a full summary of the various views and how to navigate the MicroProfiler interface, see MicroProfiler modes.
Threads
Like many programs, Roblox uses multiple threads to perform several sequences of tasks at the same time. In the MicroProfiler detailed mode, you can see labels for each thread on the left.
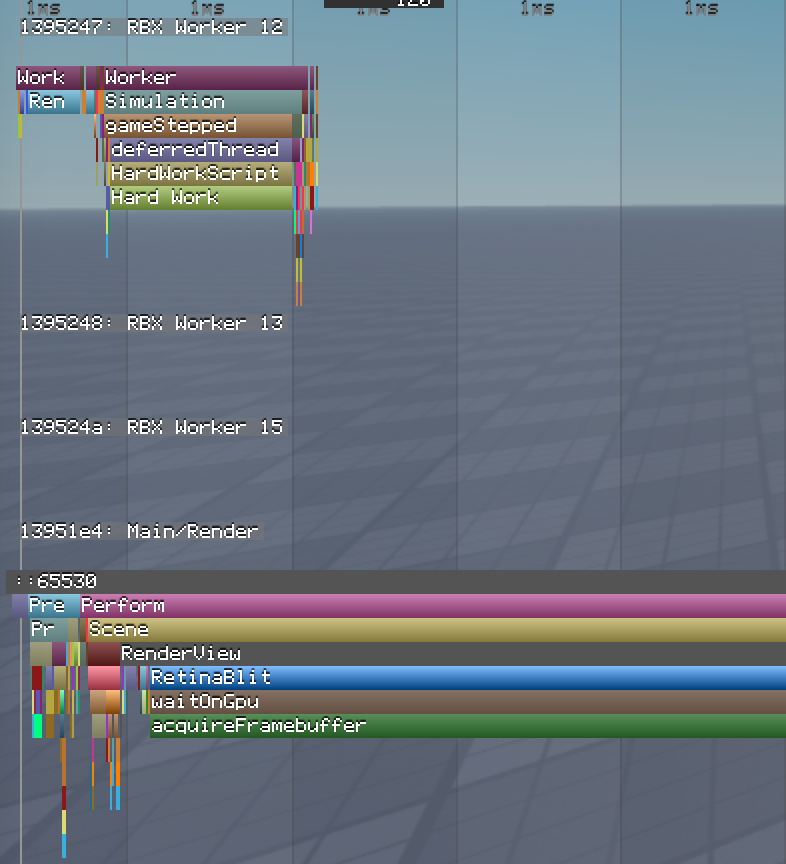
There are three main thread types:
Main/Render: Perhaps unintuitively, runs on the CPU. Processes input, Humanoids, animations/tweening, physics ownership, sound, and waiting script resumes. Also updates Studio interfaces and coordinates the other threads.
Worker ("RBX Worker"): Helps the main thread with networking, physics, and pathfinding. Due to the number of cores in modern CPUs, you likely have many worker threads, most of which are in a sleep state at any given time.
Render ("GPU"): Follows a "prepare, perform, present" logic. Communicates with the graphics processing unit (GPU) of the device.
- Prepare: Information from the main thread is used to update rendering models.
- Perform: Issue rendering commands, including 2D interfaces.
- Present: Synchronizes with the GPU.
Custom profiles
If your scripts are running complicated tasks, you can profile critical portions of the code to ensure that they're not taking too long. Wrap code in debug.profilebegin() and debug.profileend() to time everything done between those function calls and create a label on the MicroProfiler timeline.
HardWorkScript

There is a limited amount of memory available to MicroProfiler labels. If this memory runs out, custom profiler labels might not appear as a meaningful name in the timeline. Use fewer labels to avoid this issue. If you no longer need to profile a section of your code, comment out or remove calls to these functions.
Example
The code sample below connects a dummy function to the RunService.PreSimulation event, which runs every frame. Anything done this often should run as efficiently as possible, so this function is a good candidate for profiling.
local RunService = game:GetService("RunService")

local function onPreSimulation()
	debug.profilebegin("Hard Work")
	-- Example hard work: swap two variables 200,000 times
	local a, b = 0, 1
	for _ = 1, 200000 do
		a, b = b, a
	end
	debug.profileend()
end
RunService.PreSimulation:Connect(onPreSimulation)
When you run the experience and pause the MicroProfiler (CtrlP or ⌘P), the custom label is visible under the gameStepped label.

From its duration on the timeline, you can tell that the function is using a lot of processing time compared to other operations.
Save frame data
If you want to save a set of frame data for later review (or to share with someone else), use the Dump menu. The engine saves the frame data to a file named microprofile-<date>-<time>.html in the Roblox logs directory.
On Windows, check %LOCALAPPDATA%\Roblox\logs.
If you use the Universal Windows Platform (UWP) app, check \Users\<username>\AppData\Local\Packages\ROBLOXCORPORATION.ROBLOX_<hash>\LocalState\logs\.
On macOS, check ~/Library/Logs/Roblox.
These HTML files use the same web-based UI as the live connection for mobile devices and server dumps.
Profile mobile devices
To access the MicroProfiler from the mobile client, your mobile device must be connected to the same network as your development machine.
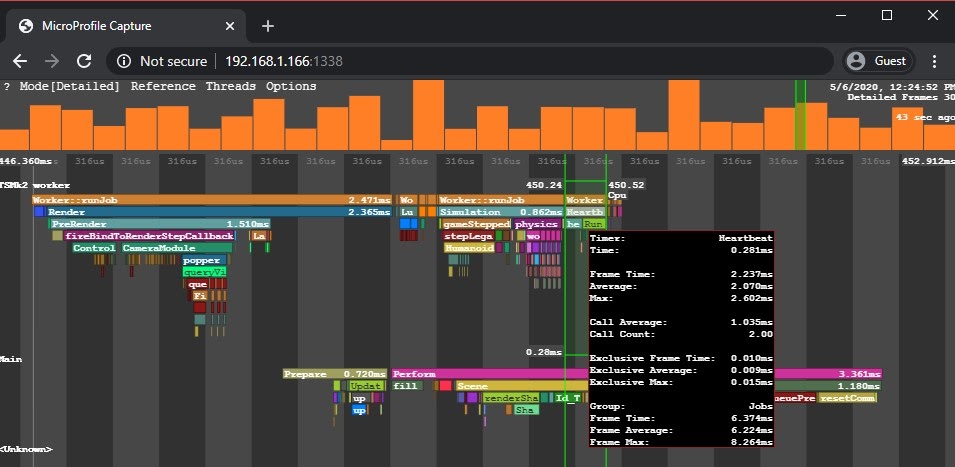
Enable the MicroProfiler in the Settings menu of the mobile device. After you enable it, the menu shows an IP address and a port number.
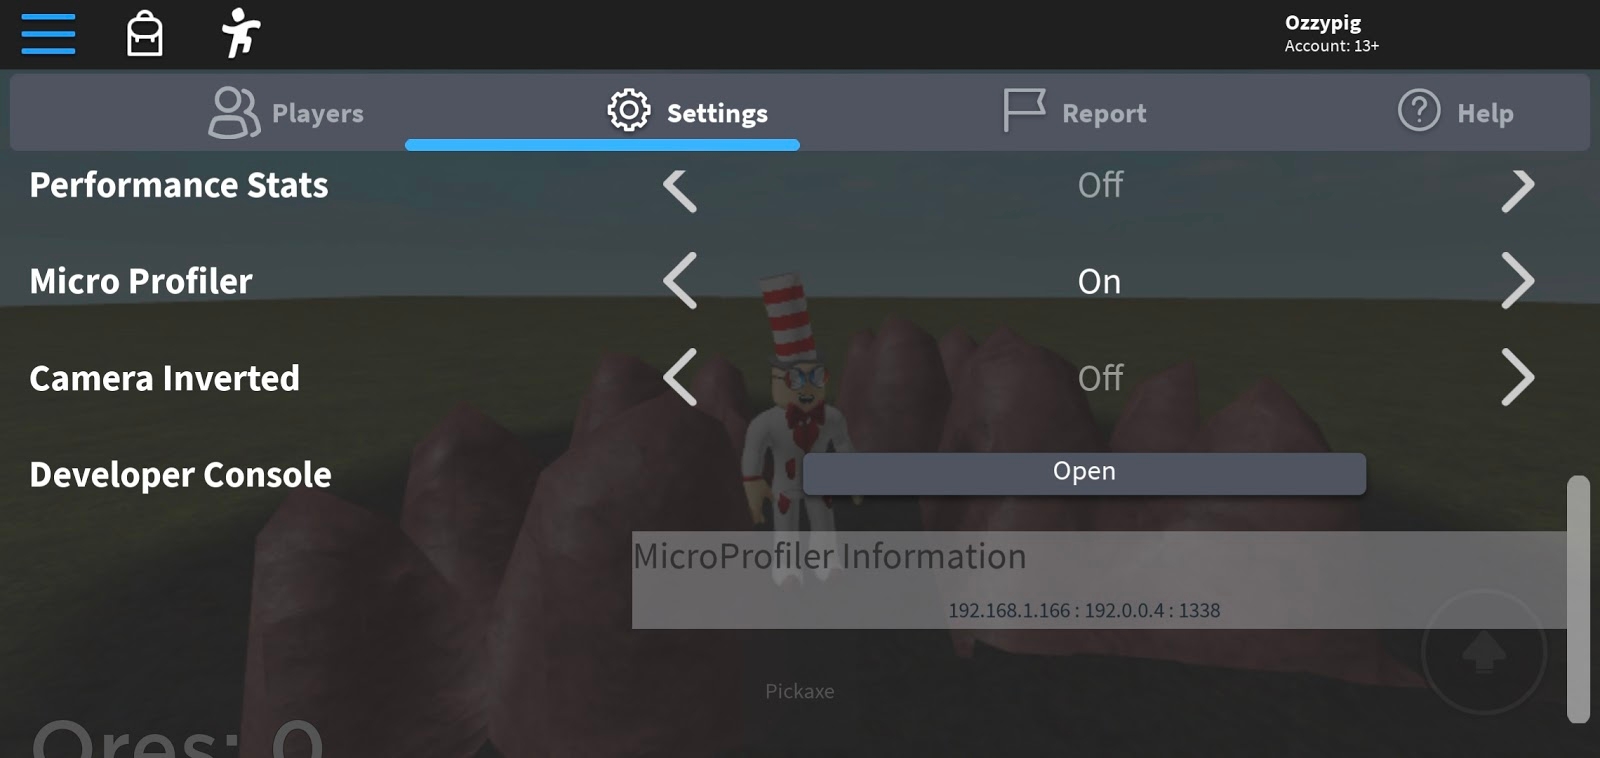
For example, in the screenshot above, the address is 192.168.1.166 and the port is 1338. From a computer on the same network, navigate to http://192.168.1.166:1338 for a web-based version of the MicroProfiler user interface.
Profile the server
In addition to the standard client MicroProfiler, you can take brief dumps of server activity using the server MicroProfiler.
In an experience that you have edit permissions for, open the Developer Console with CtrlAltF9.
In the dropdown menu, select MicroProfiler.
In the ServerProfiler section, specify the number of frames per second (maximum 60) and the number of seconds to profile (maximum 4).
Click Start Recording.

After a few seconds, the Developer Console provides the path to the file, which is the same path as a standard dump.
Use the web UI
In general, the MicroProfiler web UI works similarly to detailed mode, but it has a few additional features:
In addition to filtering by group, you can filter by thread.
Use CtrlF/⌘F to jump to the occurrence of a task that takes up the most time in the dump. For example, computeLightingPerform runs in every frame. If you search for it in a dump with 128 frames, you can jump to the frame where it took the longest to complete.
Use the X-Ray menu to enable or disable color coding for memory allocation.

- Lighter frames within the main bar graph indicate higher memory allocation.
- Lighter portions of the preview bar and lighter labels on the timeline indicate portions of the frame with higher memory allocation.
- In X-ray mode, press C to show the total size of the memory allocations rather than the number of allocations.
Use the Export menu to export a CPU or memory flame graph, a specialized visualization that aggregates all of the call stacks included in the dump, maintains the parent-child hierarchy, and sizes them based on duration. Flame graphs are especially useful for identifying tasks that don't take particularly long to run (and are therefore hard to notice), but run so often that their processing time becomes significant.

You can also create flame graphs in Studio, although only for scripts (execution time and memory allocations). Compared to the web-based flame graphs, the ones in Studio are top-down rather than bottom-up and support dramatically longer capture times.

Drag and drop a second dump file into the web UI to generate a diff flame graph, which can help you identify improvements or regressions to your experience's performance over time. Click Combine & Compare to export a new HTML file.

The diff flame graph highlights the dump (left or right) that consumes more CPU or memory, with brighter colors indicating a larger difference.
