The MicroProfiler is a performance optimization and troubleshooting tool in Roblox Studio and the Roblox client. It provides detailed, visual timing information for all the engine tasks that run during a frame, like animating characters, updating physics, running scripts, and rendering geometry. You can identify which tasks ran during which frame, how long these tasks took to run, and whether any caused you to miss your frame time goals.
Frame times
To use the MicroProfiler, you must understand the relationship between frame time and frame rate.
- Frame time is how long a frame took to render on screen, generally measured in milliseconds.
- Frame rate is the number of frames rendered on screen, generally measured in frames per second (FPS).
Lower frame times mean higher frame rate. Divide 1,000 milliseconds (1 second) by frame time to get frame rate.
| Average frame time | Frames per second |
|---|---|
| 33.33 ms | 30 FPS |
| 16.67 ms | 60 FPS |
| 8.33 ms | 120 FPS |
| 4.17 ms | 240 FPS |
For smooth gameplay, however, it's not enough to have a high frame rate. You need consistent frame times. For example, if 59 frames arrive in 10 milliseconds and one frame in 410 milliseconds, players perceive a huge, jarring stutter, even though the game is running at 60 FPS. If all frames take roughly the same amount of time to render, your game will feel perceptibly smoother due to that consistency, especially at lower frame rates.
The MicroProfiler focuses entirely on frame time. Its purpose is to help you identify frame time spikes and what caused them.
Open the MicroProfiler
Opening the MicroProfiler varies by platform:
On the mobile client, open the Settings menu and change the MicroProfiler to On. Then from a development machine on the same network, use your web browser to navigate to the provided IP address and port.
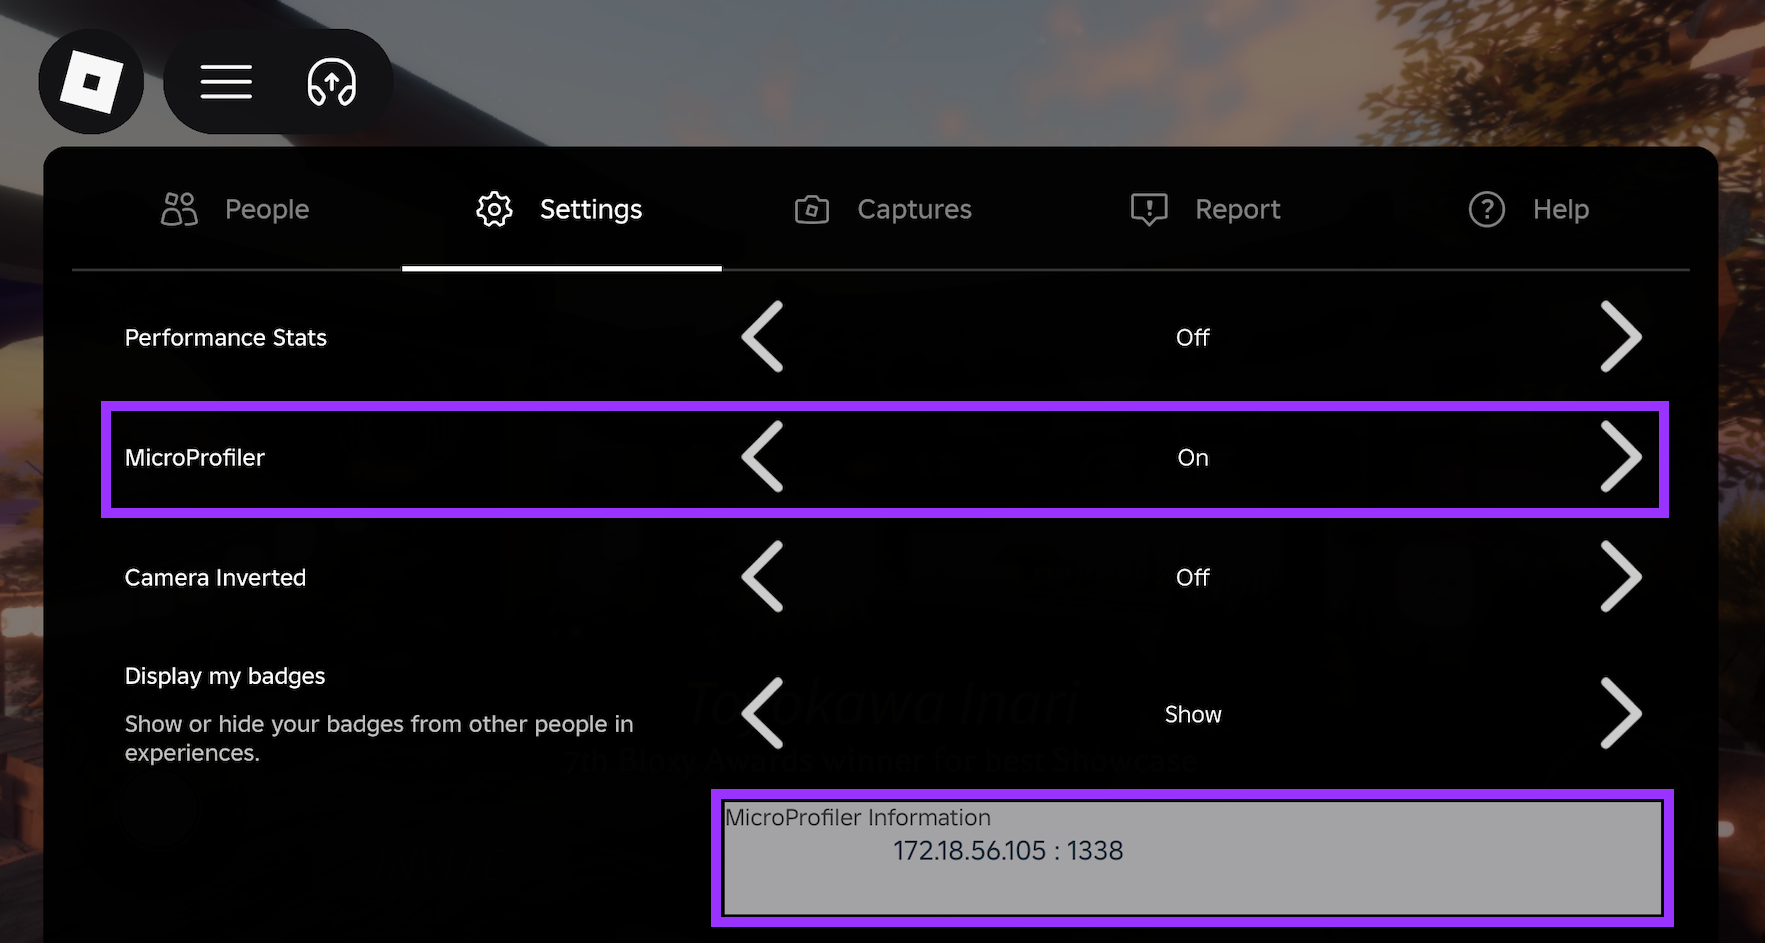
This screenshot shows an IP address of 172.18.56.105 and a port of 1338, so you navigate to 172.18.56.105:1338. Depending on your device's network configuration, you might see multiple IP addresses. If one doesn't work, try the next.
On the desktop client, press CtrlF6 (⌘F6).
In Studio, press CtrlF6 (⌘F6).

Generally, the mobile client is the best place to profile your game. Most players on Roblox use phones and tablets, and these devices have severe thermal and power constraints that limit their performance. If your game runs well on a midrange Android tablet, it almost certainly performs much, much better on a gaming desktop.
MicroProfiler basics
The MicroProfiler has two key components: the frame time bar graph and the detailed task timeline.
- The frame time graph runs along the top of the interface and shows how long each frame took to render. Taller bars mean longer frame times.
- The timeline shows all of the individual tasks that ran during the frame. Wider bars represent tasks that took longer to run.
A typical workflow in the MicroProfiler is to use the frame time graph to identify a spike (a taller bar) and then use the timeline to identify which tasks caused the spike. Then you can check the Tag reference for information on the task and how to improve its performance.

Frame time graph
The height of each bar indicates the number of milliseconds that it took to complete the frame. More recent frames are on the right. Hover over a frame for some basic information around CPU and GPU usage.

Orange bars are frames where the Jobs Wall Time exceeds the Render Wall Time. In these frames, at least one of the worker threads, which do things like run scripts, calculate physics, and play animations, took longer to run than the main render thread.
If the game is not reaching your frame time goals and has a large number of orange frames, common causes are scripts, physics, and animations. See Improve performance.
Blue bars are frames where the Render Wall Time exceeds the Jobs Wall Time. In these frames, the main render thread took more time than any of the worker threads.
If the game is not reaching your frame time goals and has a large number of blue frames, that indicates a rendering bottleneck. Common causes are excessive object density, object movement, and lighting. See Improve performance.
Red bars are frames where two conditions are true:
- Render Wall Time exceeds Jobs Wall Time
- GPU Wait Time is greater than 2.5 milliseconds
Red bars are less common than orange and blue and often the result of excessive object complexity, texture size, and visual effects. Optimization is similar to blue bars. See Improve performance.
Tiny tasks at the end of a frame can sometimes throw off the Jobs Wall Time and Render Wall Time, which is a good reason to focus more on frame time than frame color. There's no "good" color to strive for. A mixture of orange, blue, and red isn't problematic as long as you're reaching your frame time goals. If you aren't reaching your frame time goals, the colors can indicate where to optimize.
Timeline
Left-click and drag to pan the timeline. On a machine with many CPU cores, you might need to pan up or down quite a bit to find the thread performing a particular task.
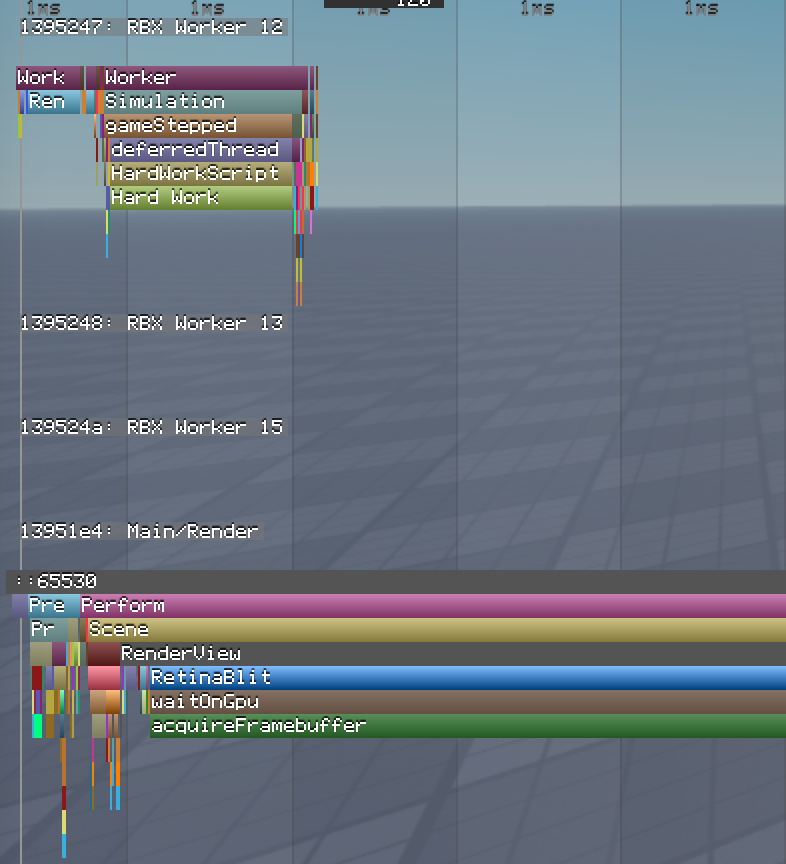
Scrolling zooms the timeline in and out. Combined with the millisecond labels at the top of the timeline, you can get a sense of how long a task took in an absolute sense, but also how long it took relative to other tasks.
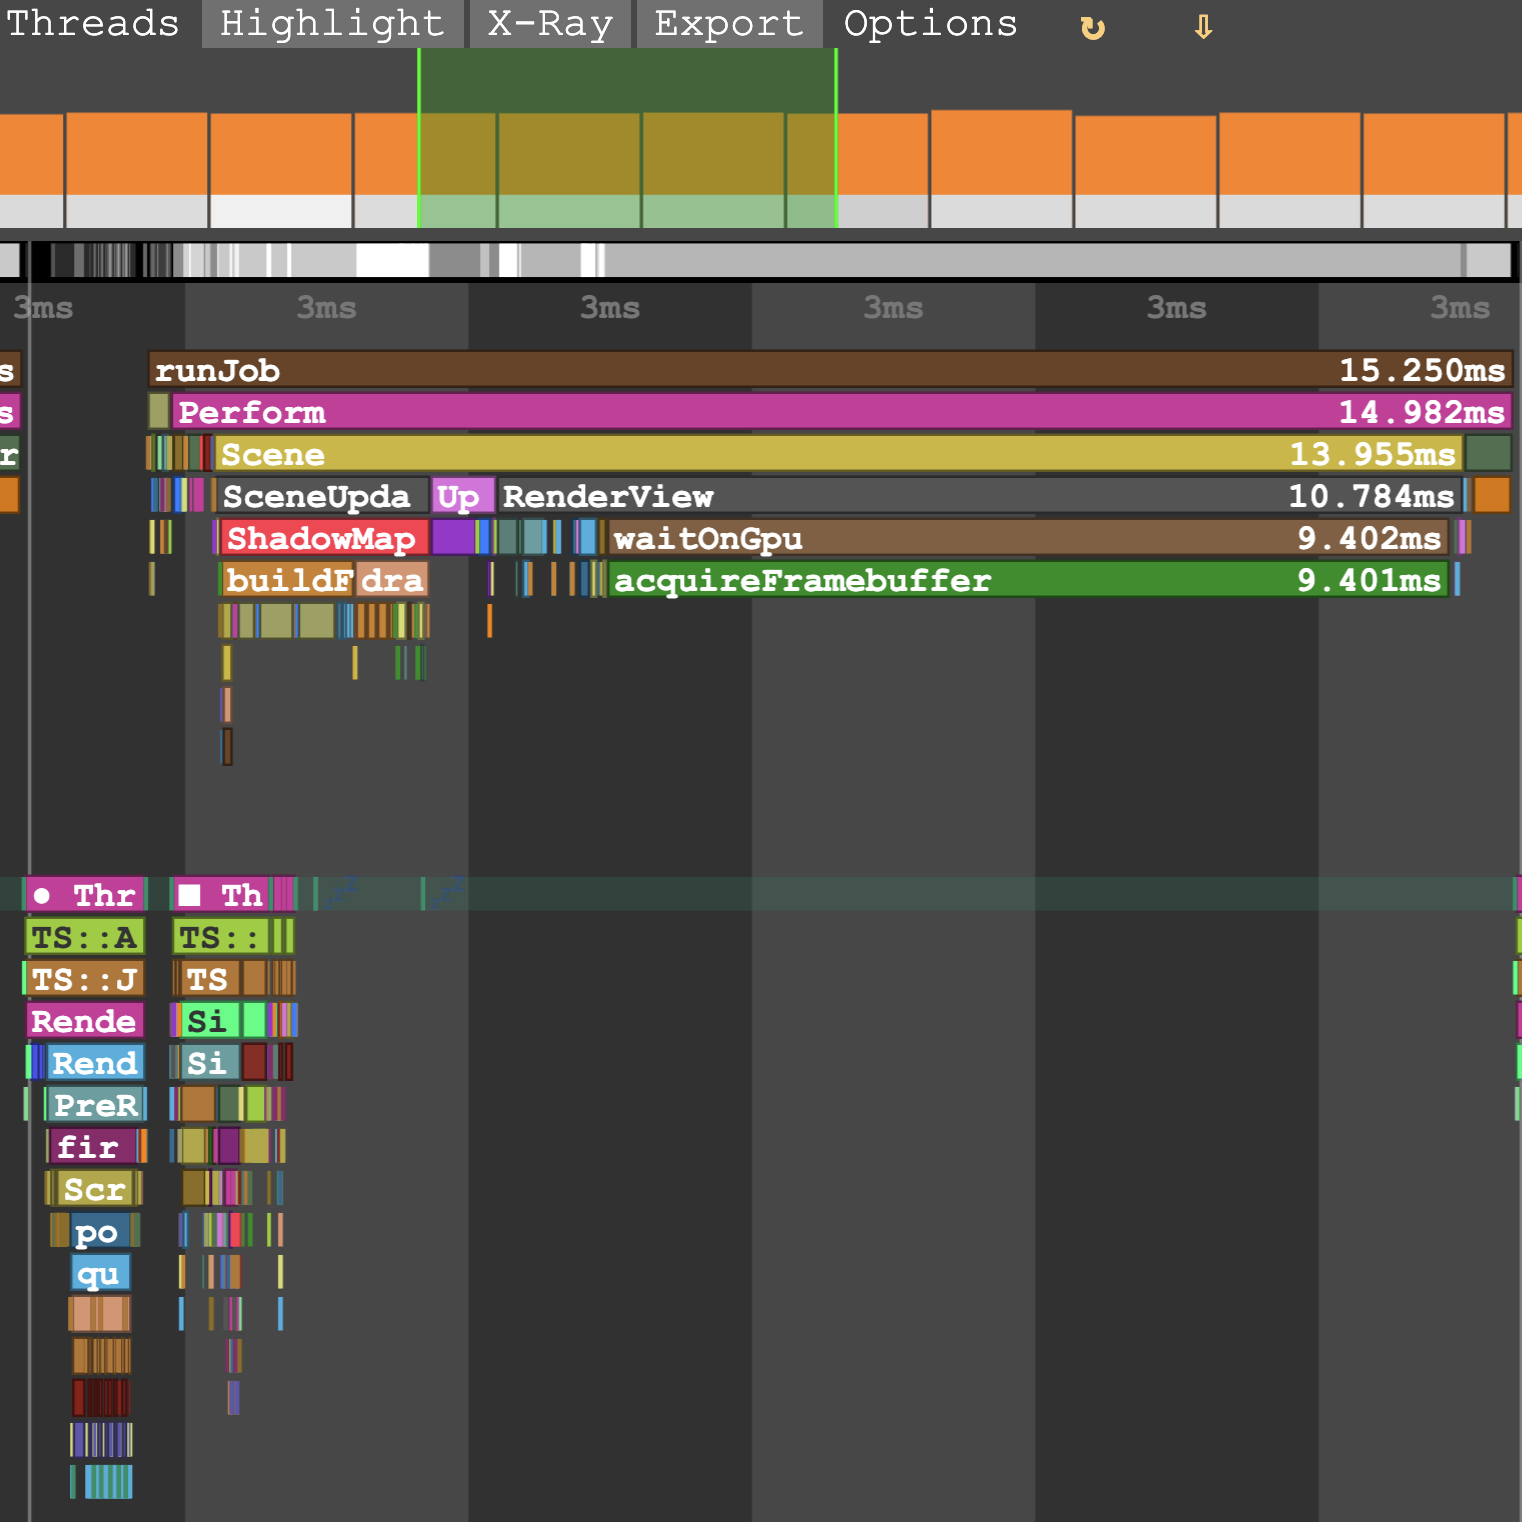
The green overlay on the bar graph indicates the number of frames currently visible on the timeline—your zoom level. Left-click on a frame bar to jump to that position on the timeline.
You might have to adjust your zoom level, but hovering over a bar highlights the frame on the timeline. Light grey lines delineate frames.

Labels that appear directly below another label indicate tasks that are performed as part of the higher-level task.
Rather than the parent task, you typically want to troubleshoot the worst-performing child tasks; a parent task can't be shorter than the sum of its child tasks.
Right-click a label to zoom the timeline to exactly the duration of that task.
If the amount of information is overwhelming, use the Groups or Threads menu to filter the timeline. For example, you might only want to see Render tasks in the main thread.

Use CtrlF (⌘F) to jump to the occurrence of a task that takes up the most time in the dump. For example, computeLightingPerform runs in every client frame. If you search for it in a dump with 128 frames, you can jump to the frame where it took the longest to complete.


Threads
Like many programs, Roblox uses multiple threads to perform sequences of tasks at the same time. The MicroProfiler displays the thread name on the lefthand side of the timeline.

There are three important thread types:
Main ("RBX Main"): Handles CPU-based rendering tasks. Processes input, Humanoids, animations/tweening, physics ownership, sound, and waiting script resumes. Also updates Studio interfaces and coordinates the other threads.
Worker ("RBX Worker"): Helps the main thread with networking, physics, and pathfinding. Due to the number of cores in modern CPUs, you likely have many worker threads, most of which are in a sleep state at any given time.
Render ("GPU"): Follows a "prepare, perform, present" logic. Communicates with the graphics processing unit (GPU) of the device.
- Prepare: Information from the main thread is used to update rendering models.
- Perform: Issue rendering commands, including 2D interfaces.
- Present: Synchronizes with the GPU.
Custom script profiles
If your scripts are running complicated tasks, you can profile critical portions of the code to ensure that they're not taking too long. Wrap code with debug.profilebegin() and debug.profileend() to time everything done between those function calls and create a label on the MicroProfiler timeline.
local RunService = game:GetService("RunService")

local function onPreSimulation()
  debug.profilebegin("Hard Work")
  -- Example hard work: swap two variables 200,000 times
  local a, b = 0, 1
  for _ = 1, 200000 do
    a, b = b, a
  end
  debug.profileend()
end
RunService.PreSimulation:Connect(onPreSimulation)
From its duration on the timeline, you can tell that the function is using a lot of processing time compared to other tasks.
Analyze captures with Assistant
In Studio, you can ask Assistant to automatically analyze a paused MicroProfiler capture, identify performance bottlenecks, and propose fixes.
- In Studio, open the MicroProfiler with CtrlF6 (⌘F6).
- When you spot a frame time spike, pause the capture by pressing Pause in the top menu or using CtrlP (⌘P).
- Open Assistant and ask it to analyze the capture. Example prompts include:
- "I've captured a frame time spike in the MicroProfiler—analyze it."
- "What caused the spike?"
- "Is it physics-bound or script-bound?"
- "Which category has the highest exclusive time?"
- "When I'm in the hangar, the FPS drops. Reproduce the issue, use MicroProfiler to find the cause, fix it, and retest."
Assistant reads the paused capture through the MicroProfiler API and returns a report on likely bottlenecks, along with proposed script or scene changes you can apply.
This functionality also works via the Studio MCP server, so you can integrate MicroProfiler analyses into your own AI agent or agentic loop to get automated feedback on how new changes impact your game's performance.
Save frame data
If you want to save a set of frame data for later review (or to share with someone else), use the Save to file button. The MicroProfiler saves frame data to a standalone HTML file named microprofile-<date>-<time>.html.

On the desktop client or in Studio, use the Dump menu. In both cases, the MicroProfiler automatically saves the file to the Roblox logs directory:
On Windows, check %LOCALAPPDATA%\Roblox\logs.
If you use the Universal Windows Platform (UWP) app, check \Users\<username>\AppData\Local\Packages\ROBLOXCORPORATION.ROBLOX_<hash>\LocalState\logs\.
On macOS, check ~/Library/Logs/Roblox.
Profile the server
In addition to profiling the client, you can capture brief dumps of server activity:
On the desktop client, join a game that you have edit permissions for.
Open the Developer Console with CtrlF9 (⌘F9).
In the dropdown menu, select MicroProfiler.
In the Server tab, specify the number of frames to capture (maximum 60) and the number of seconds to delay before starting the capture (maximum 4).
Click Begin server recording.

After a few seconds, the Developer Console provides the path to the file, which is the same path as a standard dump.

Web-only features
The MicroProfiler has two user interfaces: the web UI (mobile and dumps) and the desktop UI (client and Studio). We recommend using the web UI whenever possible. In general, the two work similarly, but the web UI has a few extra features:
Use the X-Ray menu to enable or disable color coding for memory allocation.

- Lighter frames within the main bar graph indicate higher memory allocation.
- Lighter portions of the preview bar and lighter labels on the timeline indicate portions of the frame with higher memory allocation.
- In X-ray mode, press C to show the total size of the memory allocations rather than the number of allocations.
Use the Export menu to export a CPU or memory flame graph, a specialized visualization that aggregates all of the call stacks included in the dump, maintains the parent-child hierarchy, and sizes them based on duration. Flame graphs are especially useful for identifying tasks that don't cause you to miss your frame time goals (and are therefore hard to notice), but run so often that their processing time becomes significant.

You can also create flame graphs in Studio, although only for scripts (execution time and memory allocations). Compared to the web-based flame graphs, the ones in Studio are top-down rather than bottom-up and support dramatically longer capture times.

Drag and drop a second dump file into the web UI to generate a diff flame graph, which can help you identify improvements or regressions to your game's performance over time. Click Combine & Compare to export a new HTML file.

The diff flame graph highlights the dump (left or right) that consumes more CPU or memory, with brighter colors indicating a larger difference.


Desktop-only features
On the desktop timeline, left-click a label to add it to a line graph in the bottom-right. The graph shows the time the task takes each frame. Using this graph, you can test the performance of only certain tasks in your game. When you're done, right-click the graph to hide it.

This graph is synchronized with the main profiler bars. The currently selected frame range is highlighted in green on the graph. You can also click anywhere on this graph to re-center the main profiler view to that specific frame, which is helpful for finding spikes in the detailed view.
Search the detailed view
On the desktop client, you can search for tasks by name in the Detailed view:
Open the MicroProfiler with CtrlF6 (⌘F6) and switch to Detailed mode.
Press CtrlF (⌘F) to open the search box.
Type part of a task or label name. Matching is case-insensitive and finds the text anywhere in the name. Matching labels keep their color and all other labels are dimmed. Frames that contain a match are highlighted in the frame time graph.
Move between matches:
Action Shortcut Next match F3 or Enter Previous match ShiftF3 or ShiftEnter You can also click the < and > buttons next to the search box. The current match is outlined and marked with a triangle above it, and a counter such as 12 / 340 shows its position among all matches. If the match is off screen, the timeline scrolls to it. If you've panned the timeline, navigation continues from the matches that are currently visible.
Press Esc, or press CtrlF (⌘F) again, to close the search. Closing the search doesn't close the MicroProfiler.