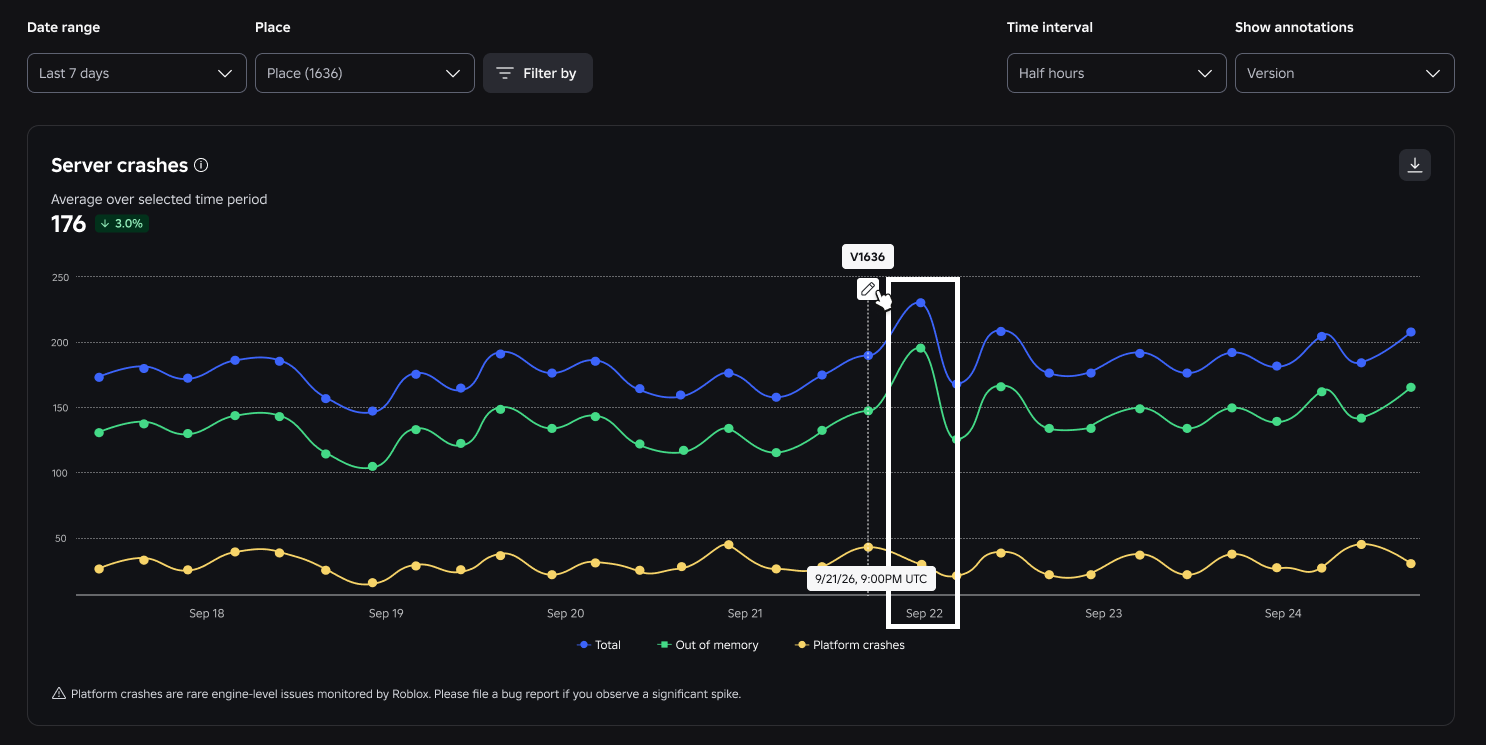
The server crashes chart and server out-of-memory snapshots can help you identify the root cause of server crashes and improve your game's stability.
When a server detects it is running out of memory, the engine automatically captures a compact JSON summary of the data model before the server shuts down. If you see a spike in your server out-of-memory crashes, you can use the chart and memory snapshots to diagnose the issue:
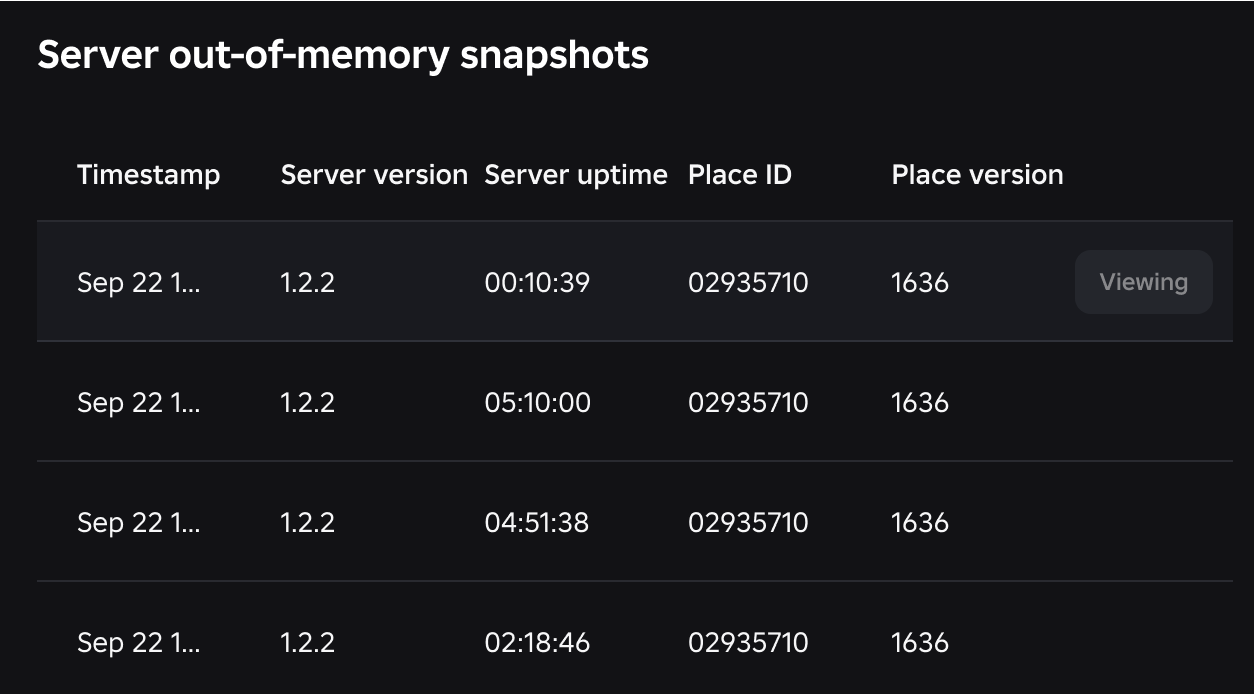
- Select a snapshot: Use the server out-of-memory snapshot list to find a crash, then examine memory usage by the latest timestamp, place ID, place version, server version, or server uptime to either find long-term memory leaks or line up the crash with reports from players or your own testing window.
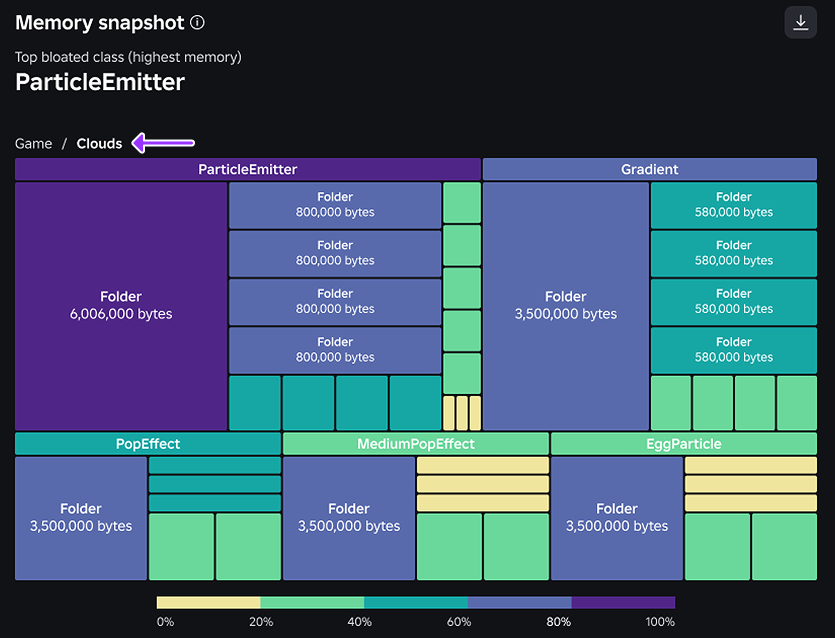
- Visualize the memory usage: Click on a snapshot to open the treemap viewer that shows nodes weighted by memory usage. You can drill into nodes to see which services, folders, or assets dominated memory at crash time.
- Investigate in Studio: Use the breadcrumbs at the top of the viewer to highlight parent containers that hold potentially bloated assets. With this context, you can jump into Studio to investigate and fix the specific script or asset causing the issue.

Access the chart
To access the server crashes chart, you must either be the game owner or have analytics group permissions.
- Navigate to the Creations page on the Creator Hub.
- Under the Creator Hub dropdown, select your account or the group that owns the game.
- Select the game.
- In the Monitoring dropdown, select Crashes.
Use the chart
The server crashes chart provides a deep-dive visibility into potential causes for server crashes. Crashes are broken down by crash reason:
- Out-of-memory crashes - Servers are crashing due to high memory usage that you can take direct action to fix.
- Platform crashes - Servers are crashing due to engine-level errors or corrupted memory when they enter an unrecoverable state. Roblox monitors and takes direct action to fix these crashes.
You can use the chart's menus to adjust date range, time interval, and annotations, and the Place menu to examine individual places rather than the entire game.

Directly below the chart is a list of server out-of-memory snapshots that you can examine either by timestamp, server version, server uptime, place ID, or place version. When you select any of these snapshots, the treemap view displays with nodes weighted by memory usage.

To demonstrate how you can use the chart and server out-of-memory snapshots to dianose a memory leak:
Identify the spike. When you notice out-of-memory crashes spiking on your server crashes chart, filter by place version so that you can confirm the location of your memory leak.
Select a snapshot. Scroll down to the memory snapshots and examine the list by the latest timestamp or server uptime. If you select a snapshot from a server that crashed within minutes of starting up, this suggests a massive, acute memory spike during initialization.
Visualize the memory. Open the snapshot in the treemap view, then click into each node to see which services, folders, or assets dominated memory at crash time. For example, the treemap view in the following video highlights Clouds as the largest node, then shows that ParticleEmitter makes up 50% of the Clouds node, indicating that heavy assets are being cloned into memory at startup but not properly parented or destroyed.
Investigate and fix. You can use the viewer's breadcrumbs to trace the context of the bloated node. Since certain assets are dynamically generated at runtime, you use this path as a starting point in Studio's Explorer window, add cleanup logic, then monitor your next update to verify the fix.